Hotel performance has strengthened over the past two weeks, despite October starting slowly. Daily data from October 1–18 shows year-over-year gains across all key metrics except occupancy, which has dipped due to new supply at the Gaylord. Even so, occupancy stands at 76.4% for the month to date—just 0.7% below the same period in 2024. Meanwhile, ADR (+1.6% YoY), demand (+3.2% YoY), RevPAR (+0.9% YoY), and total revenue (+4.9% YoY) all reflect solid growth compared to last year. This marks a welcome improvement following September’s disappointing STR report.
TravelClick data shows a bumpy ride for the rest of 2025. However, on-the-books room nights and occupancy in Q1 2026 are trending measurably higher on a year-over-year basis. Additionally, the final week of November also looks solid.
- Room Demand: 361,367 room nights (-0.3% YoY).
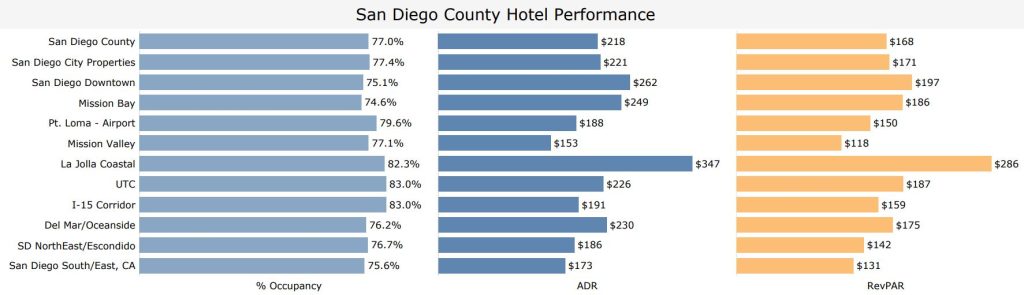
- Occupancy: 77.0% (-3.9% YoY); 8th among the top 25 U.S. markets and 4th in the western competitive set.
- Top Performing US Markets: New York (90.8%; -3.1% YoY), Boston (85.9%; -2.3% YoY), and San Francisco (83.4%; +10.1% YoY).
- Top Performing Western Competitive Markets: San Diego ranked behind San Francisco (83.4%; +10.1% YoY), Orange County (81.3%; +7.6% YoY), and Los Angeles (77.9%; -0.1% YoY).
- Highest Performing Areas Locally: I-15 Corridor (83.0%; -5.5% YoY), UTC (83.0%; +0.4% YoY), and La Jolla (82.3%; +3.4% YoY).
- ADR: $204.03 (-3.5% YoY).
- RevPAR: $158.90 (-3.6% YoY).
- Group Performance (Upscale+ Properties) and Convention Activity:
- Room Demand: 72,560 group room nights (+0.2% YoY).
- Occupancy: 34.7% (-8.7% YoY).
- ADR: $313.40 (+5.3% YoY).
- RevPAR: $108.84 (-3.9% YoY).
Convention Center Activity: TwitchCon was in town, although pickup was somewhat lower than anticipated, making a room night estimate difficult until a full audit of the event is conducted over the next couple of months.
View the complete hotel performance report here.
Leave a Reply