Excerpt from Morrison & Company, Lodging Industry Management Consulting Report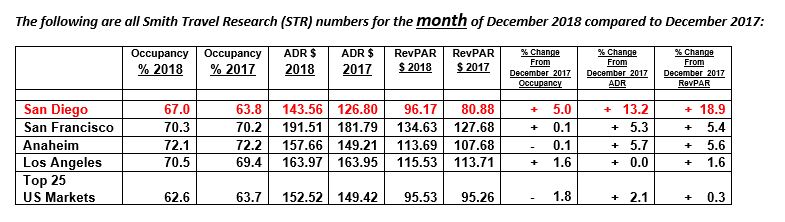
December 2018 RevPAR was flat compared to December 2017, and for the year RevPAR was up in all four major California markets.
The main takeaways for the month of December 2018 are:
- Occupancy declined in 16 of the Top 25 U.S. Markets, ADR declined in 8 and RevPAR declined in 11. Again, please remember the lodging industry follows (not leads) the economy.
- New York, once again had the highest Occupancy of 86.9%, the highest ADR of $305.32 and the highest RevPAR of $265.41 in the Top 25 U.S. Markets. Oahu had the second highest occupancy of 81.4%, the second highest ADR of $271.24, and the second highest RevPAR of $220.74 in the Top 25 U.S. Markets. Miami had the third highest occupancy of 76.0%, the third highest ADR of $257.48, and the third highest RevPAR of $195.70 in the Top 25 U.S. Markets
- The largest percentage increase in RevPAR in December was San Diego up 18.9% followed by Boston up 11.3%, and Washington, D.C. up 6.8%. The largest percentage decrease in RevPAR was Houston down 19.2% followed by Atlanta down 13.7%
- The largest ADR percentage increase for the month of December 2018 was San Diego up 13.2%, followed by Seattle up 6.0%.
The main takeaways for the year 2018 (December 2018 year to date) are:
- Occupancy declined in 12 (almost half) of the Top 25 U.S. Markets, ADR declined in 2, and RevPAR declined in 3 of the Top 25 U.S. Markets.
- Once again, the highest Occupancy, ADR and RevPAR for 2018 was New York at 87.3%, $262.31 and $228.96, respectively.
- The second highest Occupancy, the third highest ADR and the second highest RevPAR for 2018 was Oahu at 83.9%, $238.16 and $199.70, respectively.
- The third highest Occupancy, and the second highest ADR and third highest RevPAR for 2018 was San Francisco at 81.9%, $241.33 and $197.72, respectively.
- The largest percentage increase in Occupancy for 2018 was Philadelphia up 3.8%, followed by Phoenix up 2.9% and Boston up 2.3%.
- The largest percentage increase in ADR for 2018 was Miami up 6.1% followed by Minneapolis up 5.8%.
- The largest percentage increase in RevPAR for 2018 was Minneapolis up 6.9% followed by Miami up 6.3%.
- New product continued to open into the Top 25 U.S. Markets with 9 of the Top 25 U.S. Markets having increases in supply for 2018 in excess of 3%, and 8 of the Top 25 U.S. Markets up between two and three percent. Both Nashville, and Seattle had an increase in supply of 5.0% or more.
Also, please remember that there are always a number of sub-hotel markets (part of the Top 25 U.S. Markets) in the United States that are performing above or below their SMSA.
California RevPAR for this month, December 2018:
- San Diego was up 18.9%
- San Francisco was up 5.4%
- Anaheim was up 5.6%
- Los Angeles was up 1.6%
RevPAR for the Top 25 U.S. Markets was up 0.3%.
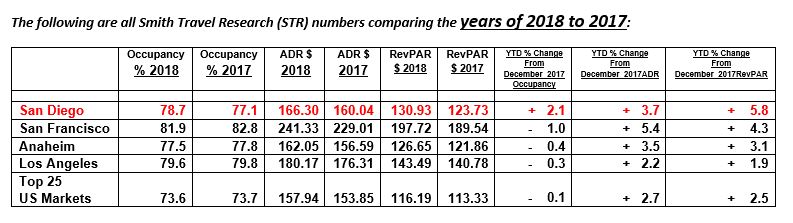
All four major California markets experienced an increase in RevPAR for 2018:
- San Diego was up 5.8%
- San Francisco was up 4.3%
- Anaheim was up 3.1%
- Los Angeles was up 1.9%
RevPAR for the Top 25 U.S. Markets was up 2.5%.

For the total United States, the year 2018 saw a small percentage increase in occupancy of + 0.05% but a higher increase in average daily rate of + 2.4%, reflecting the pricing power of the market.
Revenue per available room growth was fairly strong at 2.9% and in some of the markets was up
over 5%:
- Minneapolis – RevPAR was up 6.9%
- Miami – RevPAR was up 6.3%
- Philadelphia – RevPAR was up 6.0%
- San Diego – RevPAR was up 5.8%
- Chicago – RevPAR was up 5.1%
The two top markets with RevPAR declines were:
- Houston was down 7.5%.
- Washington, D.C. was down 3.2%.
Almost half (12) of the Top 25 U.S. Markets experienced a decline in occupancy for the year
2018.
Leave a Reply